
On almost any given search, the top three results take most of the clicks. Everyone else splits the rest. If your product isn't in those top spots, you're losing shoppers.
The question is where. Are they not seeing your listing at all? Seeing it and scrolling past? Clicking but not adding to cart? Adding to cart but buying from a competitor?
Amazon's Search Query Performance report, available through Brand Analytics in Seller Central, shows the full picture. First-party data covering every stage from search to purchase, for your brand versus the entire market. It's arguably one of the more useful datasets Amazon has made available to sellers.
The challenge is doing something with it. Especially across dozens of ASINs and hundreds of keywords. That's why we built SQP reporting into MerchantSpring, with a visual funnel, automated revenue gap sizing, and an AI Insights Agent so you can ask questions about your data instead of wrestling with spreadsheets.
This guide covers the practical side: how to read your search funnel, what each type of drop-off actually tells you, and how to put a dollar figure on the gap so you know where to focus first.
The Amazon Search Funnel: What Search Query Performance Data Reveals
An Amazon search funnel leak is any point in the shopping journey where a disproportionate number of potential customers drop off between searching for a product and buying it.
These leaks happen at four places: search to impression, impression to click, click to cart, and cart to purchase. Amazon's Search Query Performance (SQP) report, available through Brand Analytics in Seller Central, is the only tool that shows you exactly where these drop-offs occur using first-party data.
Before we get into the diagnostics, a quick frame for anyone who hasn't spent time in the SQP dashboard yet.
Every Amazon purchase that starts from search follows the same five steps: a shopper types a query, products appear in the results (impressions), some get clicked, some get added to cart, and a smaller number result in an actual purchase. SQP shows you the numbers at every stage, both for the total market and for your brand specifically. The difference between your numbers and the market total is your share.
What makes this data unusual is that it comes directly from Amazon. These are not estimates or projections from a third-party tool. This is Amazon telling you, in plain numbers, how many people searched for "wireless earbuds noise cancelling" last week, how many of those people saw your listing, and how many chose to buy from you versus everyone else.
The catch is that SQP uses a strict 24-hour attribution window. If someone searches today and buys tomorrow, SQP does not count the purchase. This means the absolute numbers will always undercount your actual sales. But for diagnosing where the funnel breaks, the relative proportions between stages are what matter. And those are reliable.
The Four Types of Amazon Search Funnel Leaks (and What Each One Actually Tells You)
Not every drop-off means the same thing. That is the part most people skip over. They see a low number somewhere in the funnel and jump straight to "I need better keywords" or "I need to lower my price." Sometimes they are right. But often, the data is pointing at something different entirely.
Let me walk through the four common break points and what I have seen each one actually indicate, based on working with hundreds of brands and agencies.
1. When shoppers search but never see your product
This is the most straightforward leak. High search volume on a keyword that is clearly relevant to your product, but your impression count is near zero.
Nine times out of ten, this is an indexing or ranking issue. Your listing either does not contain the keyword at all (check your title, bullets, and backend search terms), or it does but you are ranking on page four where nobody scrolls. The fix is usually a combination of adding the term to your listing content and running Sponsored Products on it to get immediate visibility while your organic rank catches up.
What catches people off guard is how often this happens with keywords they assumed they were ranking for. SQP regularly surfaces blind spots that keyword research tools miss, because those tools estimate search volume while SQP shows you actual impressions your brand received. There is a meaningful difference between "this keyword gets 50,000 searches" and "your product appeared zero times for this keyword." The first is opportunity. The second is a problem.
2. When they see you but do not click
This is where the real money tends to hide.
If your impression share on a keyword is healthy but your click share drops off, the shoppers saw your product in the search results and chose to scroll past it. That is a verdict on your search result presence, not your product. Specifically, it is a verdict on four things: your main image, your title, your price as displayed in results, and your review count and rating.
I want to be direct about this because I see teams burn weeks optimizing A+ Content or rewriting bullet points when their click-through problem lives entirely on the search results page. The shopper never made it to your product detail page. They decided at the results level that someone else looked more relevant, more trustworthy, or cheaper.
If you sell a premium product and your price is 30% above the median for that search term, that is fine. But your main image and title need to immediately communicate why. If a shopper cannot tell in two seconds why your product costs more, they will click the one that costs less. That is not a product problem. That is a communication problem.
Amazon's Manage Your Experiments tool lets brand-registered sellers A/B test main images for free. If your impression-to-click drop is significant on your top keywords, this is where I would start before touching anything else.
3. When they click but do not add to cart
Now we are on the product detail page. The shopper was interested enough to click. Something on the page failed to move them to the next step.
This one requires more nuance because the causes are varied. It could be that your secondary images do not answer the questions the shopper arrived with. It could be that your bullet points lead with features instead of outcomes. It could be that your A+ Content is generic. It could be a review problem, not your star rating, but the content of recent negative reviews raising a specific concern that your listing does not address.
The best diagnostic I have found for this is embarrassingly simple: find someone who has never seen your listing, send them the product page link, and ask them what questions they still have after 30 seconds. Those unanswered questions are your cart add killers. They are almost never what you expect.
One pattern I see repeatedly with agency clients: the brand knows their product intimately and unconsciously assumes the shopper does too. Details that feel obvious to the seller ("of course it fits XYZ model," "of course it includes batteries") are not obvious to someone seeing the listing for the first time. Every piece of missing clarity is a reason to click back and try the next result.
4. When they add to cart but do not buy
This one stings because the shopper was so close.
Cart-to-purchase drop-off is almost always about comparison shopping or checkout friction. The shopper added your product, then added a competitor, then bought the other one. Or they abandoned the cart entirely because the total at checkout surprised them.
The levers here are pricing (relative to competitors on the same search terms), shipping speed and cost, and Buy Box ownership. If you are FBM in a category dominated by FBA, your shipping promise is likely costing you conversions at this stage. The SQP data will not tell you this directly, but if your cart add share is healthy and your purchase share lags, it is the first thing I would investigate.
For brands with a Subscribe & Save offering, this is also worth reviewing. A 5% or 10% Subscribe & Save discount can be the tipping point that converts a cart add into a purchase, especially in consumable categories where the shopper is choosing between two equivalent options.
The Opportunity Calculator for Your Search Funnel Leaks
Diagnosing the leak matters. But the thing that actually gets teams to prioritize fixing Amazon search funnel leaks is knowing what they cost.
SQP gives you everything you need to do this math. Take a keyword where your click share is 3% and the total market gets 10,000 clicks per month. You are getting 300. If conversion runs at 8% on that term, you are making about 24 sales. Now imagine you close half the gap, moving your click share to 6%. That is 600 clicks, 48 sales. At a $35 average selling price, the difference on that single keyword is around $840 a month.
The math is simple but the tedious part is doing it across your top 30 or 50 keywords and identifying which gaps are worth fixing. That requires exporting the data, building target benchmarks, and calculating the gap for every keyword-ASIN combination. It is the kind of work that is genuinely valuable and genuinely miserable to do in a spreadsheet.
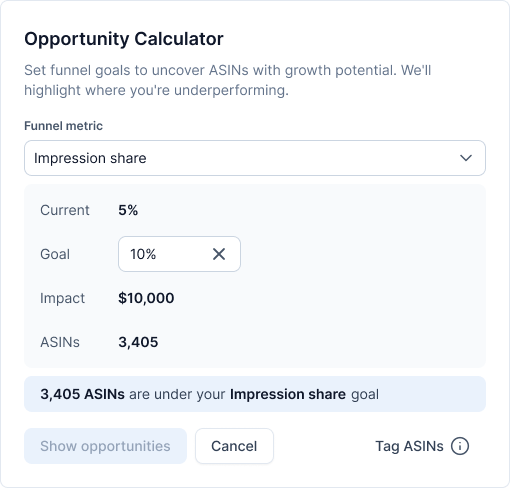
This is one of the reasons we built the Opportunity Calculator inside MerchantSpring.
You set your funnel targets (say, "I want 5% click share on my top 20 keywords") and the calculator shows every ASIN and keyword that falls short, with the revenue gap estimated in dollars. It replaces the spreadsheet.
But whether you use our tool or build your own, the principle is the same. Quantify the gap before you decide where to invest.
What Amazon Brand Analytics SQP Gets Right (and Where It Runs Out)
I want to be straight about this because I think the Amazon analytics space has too much "our tool is better" posturing and not enough honesty about what each option is actually good at.
Brand Analytics is genuinely excellent. The SQP dashboard gives you first-party data that no third-party tool can replicate. The funnel metrics are real. The share calculations are real. The ASIN-level drill-down is real. If you are a brand-registered seller and you have not explored it, stop reading this and go look at it. It is free and it is the foundation everything else builds on.
Where it gets difficult is in the workflow.
The data is presented in tables, which is fine for spot-checking but tedious for pattern recognition. If you want to compare this week to last week, you pull two reports and compare them manually. If you want to identify which of your 200 ASINs has the largest click share gap across your top keywords, you are looking at an afternoon in Excel. And if you manage multiple brands (as most agencies do), every one requires a separate Seller Central login. The data is there. The workflow to act on it efficiently is not.
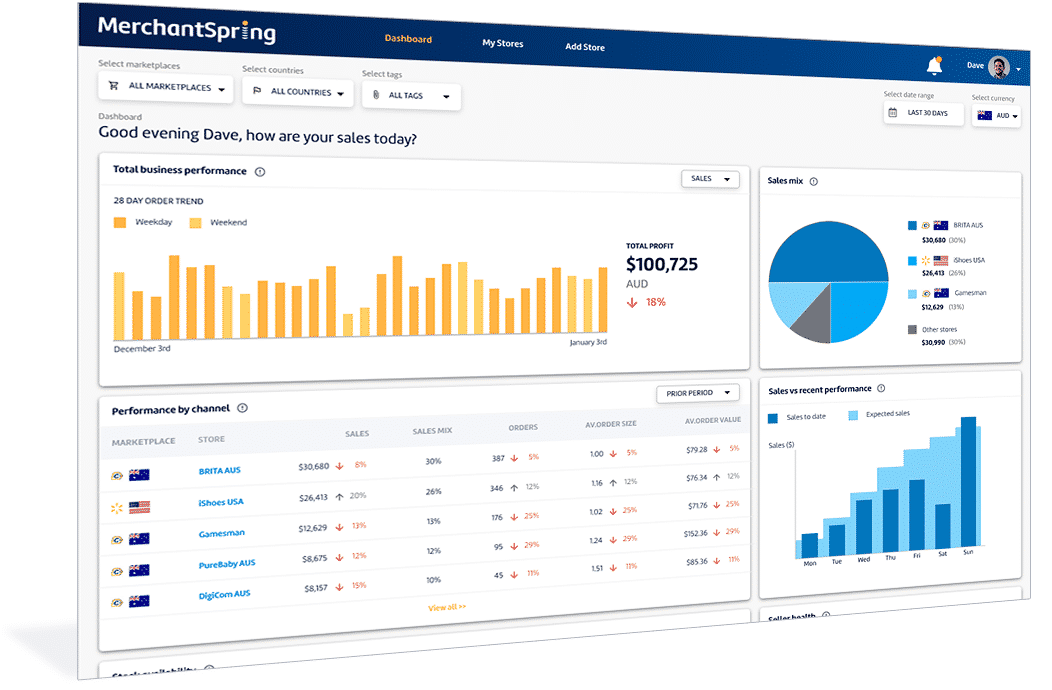
That is the gap MerchantSpring fills. We pull the same data through Amazon's SP-API, then layer on the visual funnel, period-over-period trending, the Opportunity Calculator for revenue sizing, and an Insights Agent that lets you ask questions about your data in plain English instead of building pivot tables. For agencies, you can switch between client accounts without the Seller Central login shuffle.
We are not replacing Brand Analytics. We are taking the data it provides and making it practical to act on at speed, especially if you are managing more than one brand.

For a deeper tactical walkthrough covering ten specific use cases for Search Query Performance data, including keyword discovery, PPC optimization, and seasonal trend tracking, our companion deep-dive covers it all: 10 Powerful Ways to Use Amazon's Search Query Performance Report.
Who Should be looking at This
-
If you manage Amazon advertising for clients and your reporting stops at keywords and ACoS, SQP data fills a gap your clients will eventually notice. The agencies showing full-funnel visibility first will have an edge in retention and new business conversations.
-
If you run ecommerce for a brand and you know your sales numbers but have never mapped the journey from search to purchase, the middle of the funnel is almost certainly where you are losing the most revenue. Not keywords. Not pricing. The middle.
-
If you are a PPC specialist, Search Query Performance data changes the way you allocate spend. Instead of guessing which keywords to bid on based on estimated search volume, you can see the actual funnel performance for each term and direct budget toward keywords where your brand has a conversion advantage but a visibility gap.
What to Do Next
If you are already on MerchantSpring, the SQP module is live in your dashboard. Check out the report for your brand or client and see where the funnel narrows.
If you are not on MerchantSpring, you can start a free trial or book a walkthrough. We will show you what your search funnel looks like from when the search happens.

Frequently Asked Questions
1. What is the Amazon Search Query Performance (SQP) report?
SQP is a Brand Analytics dashboard inside Seller Central that shows the full search funnel for brand-registered sellers. It reveals how many times a keyword was searched, how many products appeared, how many were clicked, added to cart, and purchased.
It also shows your brand's share at each stage compared to the total market.
2. Is SQP data available to all Amazon sellers?
No. SQP is only available to sellers enrolled in Amazon Brand Registry through Seller Central. It is not available to Vendor Central users. You have to be an Amazon Seller (3P), Brand Registry, Brand Analytics Selling Partner API role.
3. Marketplace availability
As of March 2026, Amazon SQP report is available in North America, Spain, UK, France, Netherlands, Germany, Italy, Sweden, Turkey, Saudi Arabia, UAE, India, and Far East (all marketplaces).
It is not available in certain recently launched EU marketplaces (e.g. Ireland, Belgium, Poland).
4. What is the difference between SQP in Brand Analytics and in MerchantSpring?
The underlying data is the same Amazon data. Brand Analytics presents the data in tables that require manual export and comparison.
MerchantSpring adds a visual funnel, your performance per ASINs, per metric, per search term. It also includes an Opportunity Calculator that sizes revenue gaps in dollars, an Insights Agent for plain-English questions, and easy switching between multiple brand accounts for agencies.
As of March 2026, MerchantSpring offers Amazon Search Query Performance reporting on a monthly period only due to large data volume, Amazon API cost considerations, and strategic value of trend-based optimization.
5. Is this feature available in all MerchantSpring plans?
Yes. All plans (including trial) have access. The number of ASINs included in each plan is different.


Add a Comment