10 Powerful Ways to Use Amazon’s Search Query Performance (SQP) Report [+ New API Update]

Introduction: Amazon’s Search Query Performance (SQP) Report is a powerful analytics tool that gives brand-registered sellers an inside look at how shoppers discover and engage with their products via Amazon search. Available through Amazon Brand Analytics for enrolled brands, the SQP dashboard reveals a full “search funnel” – from the number of times a search term was queried, to how often your listings appeared (impressions), how many clicks you earned, how many carts were added, and how many purchases resulted. In essence, it’s like an X-ray of customer search behavior, showing exactly where in the journey shoppers might be slipping away.
This first-party Brand Analytics data is incredibly valuable because it’s sourced directly from Amazon (not third-party estimates). You can see your brand’s performance and market share for each query at each stage of the funnel – impressions, clicks, add-to-carts, and purchases – compared to the total market. For example, if your click share on a high-volume term is only 5%, that’s a clear signal to improve your visibility or advertising on that keyword. By surfacing the exact search terms customers use, the SQP report also doubles as a keyword research goldmine for Amazon SEO and PPC, reflecting real shopper demand and emerging trends. In short, SQP shines a light on how shoppers find (or fail to find) your products, guiding you on where to double down and where to course-correct in your Amazon marketing strategy.
Below, we explore 10 in-depth use cases for leveraging Amazon’s SQP Report data – at both the brand level and ASIN (product) level – to drive growth. Each use case includes a benefit-focused explanation, notes whether it’s best suited to brand-level or ASIN-level data, and addresses common questions from Amazon sellers (like using SQP to improve listings, boost rankings, identify underperforming terms, understand the “search funnel,” and even automate it via API). Let’s dive in!
1. Identify Top Search Queries Driving Your Sales (Brand-Level Insights)
One of the first things to do with Amazon SQP data is identify which search terms are most valuable for your brand. The SQP report ranks your top search queries (up to 1,000 terms) along with their impression, click, cart, and purchase metrics. By reviewing this, brand owners can immediately see which keywords are driving the most impressions and purchases for their products. These high-value queries should be front-and-center in your Amazon SEO strategy – ensure they’re woven into your product titles, bullets, and backend keywords to maximize organic visibility (using SQP as an Amazon SEO tool for keyword placement). Likewise, confirm that you’re running Sponsored Product campaigns on these terms to defend and grow your market share. Using brand-level SQP data, you get the “big picture” of your brand’s top-of-funnel opportunities. For example, if Brand Analytics shows that “wireless earbuds noise cancelling” is one of your top queries by sales, you’d prioritize optimizing your listings and ads for that term. Overall, this use case answers “how to use SQP data to optimize Amazon product listings” – by focusing on the keywords that matter most and doubling down on them.
Best for: Brand-Level SQP View (to see the aggregate impact of search terms across your product portfolio).
2. Discover Keyword Opportunities Your Brand Is Missing (Brand-Level)
The SQP report not only highlights what you’re doing well – it also uncovers keywords where you’re underperforming or missing out. Look for high-volume search terms where your brand’s impressions or purchase share is low. These are essentially untapped opportunities: large numbers of shoppers are searching these terms, but your products aren’t capturing much of that traffic. For instance, if a query has thousands of searches per month but your brand accounts for only a tiny fraction of impressions or sales, it’s a signal that you could be doing more. Perhaps you haven’t optimized for that keyword, or you don’t have the right product variation. Discovering these “gap” keywords is crucial for both listing optimization and product strategy. You can incorporate these terms into your content (to index and rank organically) or create new advertising campaigns to target them. In some cases, you might even decide to develop a new product or variation if the search demand is strong and your current catalog doesn’t serve it well – for example, if “waterproof travel backpack” is trending and you only sell regular backpacks, that might inspire an expansion in your product line. In sum, using SQP data to find high-volume queries your products are missing allows you to expand your reach and answer “how to use SQP data to find new keywords” that can drive additional traffic.
Best for: Brand-Level SQP View (to spot broad keyword gaps across your brand’s search landscape).
3. Boost Visibility on High-Value Search Terms to Improve Rankings (Brand-Level)
Every Amazon seller wants better organic rankings. SQP data can directly inform your ranking strategy by showing where you have room to boost visibility. Specifically, identify high-value search terms where your impressions are low relative to the total search volume. If a keyword is highly searched but your products barely show up (low impression count or share), it likely means you’re ranking too low organically or not indexed at all. To “boost rankings using SQP,” start by increasing your presence on these terms. You might refine your SEO – ensure the keyword is in your title or key content so Amazon’s algorithm knows your product is relevant. Simultaneously, consider upping your ad spend or bids for these terms to gain additional exposure at the top of search. SQP essentially lets you quantify where you’re being outperformed: for example, if total impressions for “organic dog treats” are massive but your brand’s impression share is, say, 2%, you know competitors are getting the lion’s share. By optimizing your listing content and running Sponsored ads on “organic dog treats,” you can start to capture more impressions and climb higher in the search results. Over time, as your click-throughs and sales grow, your organic ranking should improve (creating a virtuous cycle). In short, SQP helps you target the exact keywords where a little more effort could significantly boost your search ranking and sales.
Best for: Brand-Level SQP View (to gauge your overall impression share on key terms; you can then drill down by ASIN to execute the improvements).
4. Optimize Listings to Improve Click-Through Rate (ASIN-Level Insights)
Getting tons of impressions on a search term is great – but only if those impressions turn into clicks. SQP’s “impressions” and “clicks” metrics form a classic click-through rate (CTR) funnel. If you notice a query where your product has high impressions but relatively few clicks, that’s a red flag that your listing isn’t attracting attention in search results. Perhaps your title isn’t compelling, your main image isn’t eye-catching, or your price isn’t competitive. Using the ASIN-level SQP data, you can pinpoint this on a product-by-product basis: for example, your flagship ASIN might appear in 5,000 searches for “4K monitor”, but if it only gets 50 clicks (while competitors soak up the rest), your CTR is low. To “use SQP to improve listings,” focus on making your product more enticing in the search results. This could mean A/B testing a more attractive main image, tweaking your title to highlight a key feature or benefit, or adding a coupon badge to stand out. As one guide notes, queries with lots of impressions but few clicks indicate your product isn’t enticing shoppers – so consider improving your title or image (or even running a small ad) for those keywords. By optimizing for clicks, you’ll not only drive more traffic to your pages but also improve your organic ranking (since higher CTR can signal relevance to Amazon’s algorithm). In summary, SQP helps you identify underperforming search terms in terms of CTR, so you can refine your listing content and presentation to capture those missed clicks.
Best for: ASIN-Level SQP View (to evaluate CTR issues for each product on specific queries).
5. Fix Conversion Gaps to Turn Clicks into Sales (ASIN-Level)
Another common question sellers ask is how to use SQP data to boost conversion and sales. The SQP “cart adds” and “purchases” metrics help you see how well clicks are converting into actual orders – highlighting any underperforming search terms in terms of conversion. If you find a particular query where your product gets plenty of clicks but very few purchases, that’s a sign of a conversion problem. Shoppers are interested enough to view your product, but something on the detail page is causing them not to buy. With ASIN-level analysis, you can diagnose this per product. For example, if your gaming chair ASIN has 100 clicks from the query “ergonomic office chair” but only 2 purchases, you likely have an issue to address. It could be that your price is too high relative to competitors, your product description or images aren’t convincing, or you’re lacking social proof (reviews). SQP’s funnel data essentially asks “where are customers dropping off?” – if the drop-off is at the add-to-cart or purchase stage, work on your conversion rate. You might add more persuasive images or A+ content to address doubts, adjust pricing or offer a coupon, or improve your review count/ratings. In some cases, the issue might be relevance – maybe your product wasn’t the right match for the keyword (in which case, consider if you should really target that term). The goal is to turn more clicks into sales by fixing whatever is preventing the conversion. As one tip suggests, if people click but don’t buy, you likely need to fix something on your product page – be it content, price, or trust factors – to win those sales. By systematically addressing these conversion gaps, you’ll boost your purchase share and overall sales for those search terms.
Best for: ASIN-Level SQP View (to identify conversion issues on a per-product, per-query basis).
6. Refine Your PPC Campaigns with SQP Insights (Brand-Level & ASIN-Level)
The Search Query Performance Report isn’t just for organic optimization – it’s also a treasure trove for Amazon advertising (PPC) strategy. In fact, many top Amazon agencies now integrate SQP data into their campaign management. Here are a few ways to leverage SQP for PPC:
-
Harvest new keywords for ads: SQP surfaces the exact terms shoppers use, including ones you might not have targeted yet. If you discover high-volume, high-relevance queries in the SQP that you weren’t bidding on, add them to your Sponsored Products or Sponsored Brands campaigns. These are proven terms customers use, making them prime targets for ads.
-
Adjust bids based on performance: SQP can highlight keywords that get lots of impressions but minimal results (clicks or conversions). For such terms that “drive clicks without sales,” you might lower your bids or even pause them in ads, since they don’t match your product well and could be wasting ad spend. Conversely, identify keywords where your conversion rate is excellent – if you see certain search terms where, say, you have a small number of impressions but a surprisingly high purchase rate, that indicates a highly relevant keyword. Bid more aggressively on those to win top-of-search placement and increase volume. In other words, double down on terms that convert well for you, because scaling those up can directly boost sales.
-
Align PPC with the search funnel: SQP’s share metrics (impression share, click share, purchase share) can guide your ad strategy. For example, if your share of impressions on an important term is very low, you might not be visible enough – running ads can get you seen. If your impression share is okay but click share is low, maybe your ad creative or relevance needs work. If click share is healthy but purchase share is low (lots of clicks from ads but few sales), reconsider if the keyword is too broad or if your product detail page needs optimization to support the ad traffic. This way, you ensure your ad spend is efficient and effective at each stage of the funnel.
In summary, using SQP as an Amazon SEO tool for PPC means you are grounding your advertising decisions in real shopper data. One authoritative source puts it succinctly: bid more on keywords that convert well, and cut spend on terms that bring clicks without sales. Additionally, include strong-performing search queries in your product listings to improve organic rank (which boosts ad efficiency too). The result is a tighter, more optimized advertising campaign that works hand-in-hand with your organic strategy.
Best for: Brand-Level SQP View (to identify overall keyword opportunities/threats for ads) and ASIN-Level (to refine at the product campaign level).
7. Monitor Your Brand’s Search Funnel & Market Share (Brand-Level)
One of the unique values of the SQP dashboard is the ability to monitor your brand’s share of customer searches over time – essentially your share of voice in organic search. At the brand level, SQP provides total market metrics for each query (total impressions, total clicks, etc.) alongside your brand’s counts and share percentages. This lets you gauge how you’re performing relative to competitors on those keywords. Monitoring these shares is a great way to assess your brand’s health in the marketplace and quickly spot competitive shifts. For instance, if you’ve historically held 20% of clicks on “wireless charger” but see that your click share dropped to 10% this week, it’s a flag to investigate – perhaps a new competitor entered the scene or a rival ran a big promotion. SQP answers the question “what is our market share at each stage of the search funnel?” and helps you react accordingly. If your share of impressions is low on a critical term, you know visibility is an issue (and maybe a competitor is out-ranking you) – time to optimize content or boost ads. If your click share drops despite solid impressions, your CTR might be slipping (maybe competitors have more appealing listings now). And if your purchase share falls off, your conversion relative to others might be the problem. By tracking these metrics weekly or monthly, you essentially set up an early warning system for competitive pressure. Amazon experts often recommend to “track your brand’s share of impressions, clicks, and purchases on important search terms – if your share drops on a key query, investigate why (a competitor might be gaining) and respond to protect your visibility”. In practice, this use case means regularly reviewing a handful of your most important keywords in the SQP report and noting your brand’s funnel metrics. It’s an ongoing health check that ensures you maintain (and ideally grow) your presence in the searches that matter most to your business.
Best for: Brand-Level SQP View (for a broad competitive overview of each query’s funnel).
8. Track Trends and Seasonality in Customer Search Behavior (Brand-Level)
Amazon’s search trends can change rapidly – seasonality, holidays, or emerging trends can spike interest in new keywords. The SQP report, especially with its timeframe filters (weekly, monthly, quarterly), is a fantastic tool for monitoring how search query volumes and performance change over time. By comparing SQP data across different periods, you can answer questions like: Which search terms are gaining popularity? Which are fading? Are shoppers searching differently this quarter than last? For example, a gardening supplies brand might see “outdoor patio lights” searches surge in spring, or a toy brand might see “fidget toys” suddenly climb the ranks due to a viral trend. By tracking these shifts in the SQP data, you can adapt your strategy proactively. If a rising search volume indicates a hot trend or seasonal demand, you might boost stock for related products, step up advertising, or create promotions to capitalize on the wave. On the other hand, if you notice a once-popular term is declining in volume every month, it could signal market saturation or a change in customer preferences – perhaps it’s time to diversify your offerings.
Many sellers use SQP’s Search Query Volume metrics like a pulse on the market. A best practice is to save or export the weekly report and chart key metrics to visualize trends (some third-party Amazon SEO tools can automate this). Amazon’s new API for SQP (more on that shortly) also makes it easier to build a dashboard for trend tracking. The end result is being ahead of the curve: you’ll know if interest in “keto snacks” is exploding or if “fidget spinner” searches have tapered off, allowing you to allocate resources and marketing efforts accordingly. In summary, SQP data helps you understand shifts in customer demand over time – rising queries may indicate great opportunities to double down, while declining ones might hint at category fatigue or the need to pivot. Use this to fine-tune your campaigns and inventory planning on a weekly/monthly basis.
Best for: Brand-Level SQP View (to observe overall search volume trends and broad shifts).
9. Drill Down with ASIN-Level Data to Improve Individual Products (ASIN-Level)
While brand-level insights are great for big-picture strategy, the SQP report’s ASIN View is where you can get very tactical. Toggling to ASIN-level data lets you see the search queries (and the full funnel metrics) for a single product. This is immensely useful for optimizing each ASIN in your catalog according to its unique strengths and weaknesses. Essentially, you’re answering: “For product X, what searches is it ‘winning’ and where is it ‘losing’?”. Here’s how you might use ASIN-level SQP data:
-
Identify each ASIN’s top-performing keywords: For each product, note which search terms bring it the most clicks and purchases. Ensure those keywords are prominently featured in that product’s content. If a particular ASIN does exceptionally well for a certain long-tail query, you might even consider focusing that product’s copy and images around that use-case to further boost conversion.
-
Find “missing” keywords for the ASIN: Compare the ASIN’s keyword list to your brand’s overall list. Are there relevant queries where your brand gets sales, but this specific product doesn’t show up? If so, maybe another product of yours is capturing that term. You can then update this ASIN’s listing to target that keyword as well, if appropriate, so it also has a chance to rank. For example, if your brand-level data shows lots of sales for “stainless steel water bottle” but one particular bottle ASIN isn’t appearing for that term, perhaps add “stainless steel” to its title or attributes.
-
Customized fixes: Using the funnel metrics per ASIN, you can tailor optimizations. If Product A has a click-through issue for certain queries, focus on improving its main image or title (versus a broad change across all products). If Product B has a conversion drop-off for a keyword, maybe its price is higher than your other ASINs – you might adjust pricing or bundling for that specific item.
Overall, the ASIN drill-down enables fine-grained optimization – treating each product as its own business with its own keyword strategy. As Amazon’s documentation notes, Brand View gives the big picture, while ASIN View “helps you diagnose performance at the product level,” e.g. seeing which queries a particular ASIN is winning or missing out on. This is extremely valuable for larger catalogs or agencies managing multiple SKUs, ensuring that no product is left behind. It also helps in identifying underperforming search terms for each ASIN so you can take action right where it’s needed (whether that’s listing edits, ads, or even product repositioning). In practice, many sellers cycle through their top ASINs’ SQP data each month as a checklist for continuous improvement.
Best for: ASIN-Level SQP View (for product-specific keyword and funnel optimization).
10. Inform Product Development and Inventory Decisions (Brand-Level)
Beyond marketing optimizations, SQP data can provide strategic insights for your product development and inventory planning. The search queries your brand interacts with are essentially a direct window into customer demand. By analyzing this data, you can discover not only keywords for marketing, but also gaps in the market or new product ideas. For example, imagine your brand sells organic teas and you notice a rising query “turmeric ginger tea” that has huge search volume, but your purchase share is minimal because you don’t offer that flavor. This might validate an opportunity to launch a turmeric ginger blend to meet that demand. Likewise, if SQP trends show “waterproof phone case” searches skyrocketing and you only sell standard cases, you might consider an IP67-rated product. On the flip side, if you see search interest in one of your product categories waning over months (e.g., “fidget toys” declining), you might reduce inventory orders or diversify into other trending niches. Essentially, SQP acts as market research: rising volumes signal where to invest, and declining volumes caution where to pivot.
Another angle is seasonal inventory – by knowing when certain searches peak, you can better forecast stock. SQP weekly data might show that searches for “snow boots” start climbing in October; as a brand selling boots, you’d want your inventory and marketing ramped up before that peak hits. Additionally, if you see a competitor’s branded search term appearing in your SQP list with increasing impressions (meaning shoppers are looking for that brand’s products but finding yours), it could hint at a trend or product feature that competitor has, which you might want to emulate or capitalize on. In short, treat the Search Query Performance report as more than an SEO tool – it’s a business intelligence tool. It answers questions like “What new products might customers be looking for that we don’t yet offer?” and “How is customer interest shifting across categories?” Armed with that knowledge, brand managers can make data-driven decisions on product line expansions, discontinuations, or inventory adjustments. This ensures you’re not just reacting to the market, but proactively aligning your product roadmap with what Amazon shoppers are actively searching for.
Best for: Brand-Level SQP View (for holistic market demand insights that drive strategic decisions).
New API Access: Automating SQP Data for Scalable Insights
(2025 Update) – In exciting news for sellers and agencies, Amazon recently made the Search Query Performance data available via its API. This means you can now programmatically pull SQP reports without manual downloads, enabling automation, custom dashboards, and integration with other tools. The update (effective Feb 26, 2025) introduced new report endpoints for both Search Query Performance and Search Catalog Performance in the Selling Partner API, covering multiple marketplaces. Why is this a big deal? In short, it unlocks scale and efficiency. Here are a few ways the new API access empowers brands and agencies:
-
No more manual work: Previously, tracking SQP data over time meant logging into Seller Central, downloading CSV files (weekly, for each brand), and merging them to analyze trends – a very time-consuming process. Now, you can set up an automated script or use a third-party solution to fetch your SQP data on a schedule. For example, an agency managing 10 brands could schedule a weekly API pull for each brand’s SQP report and automatically load it into a spreadsheet or database. This eliminates hours of repetitive work, freeing up time to focus on analysis and strategy.
-
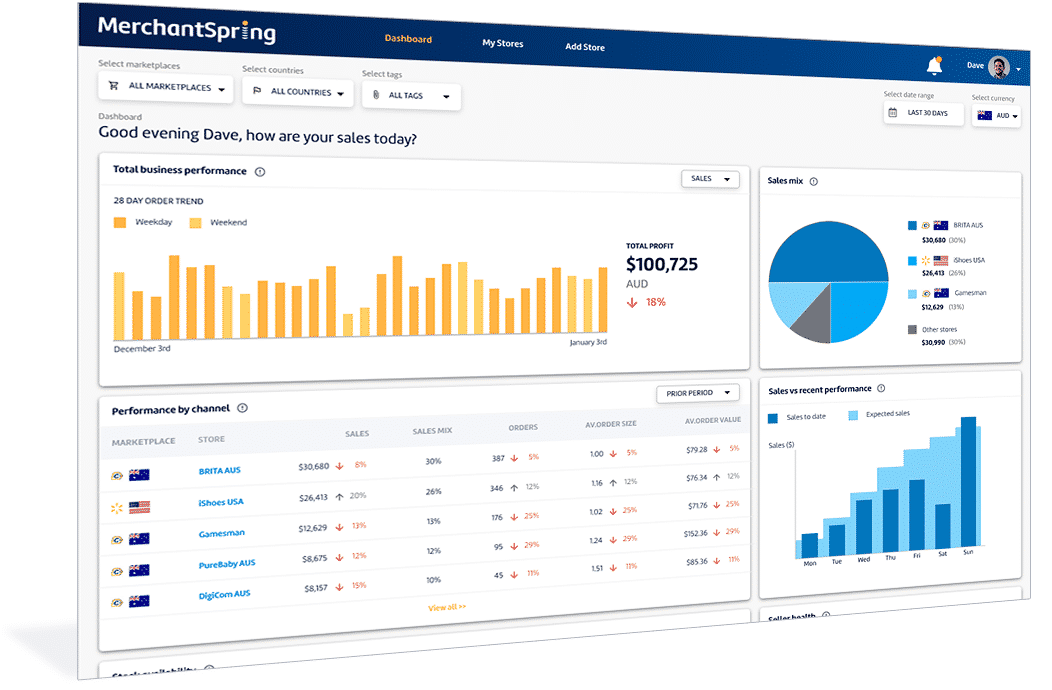
Real-time dashboards and alerts: With API access, it’s easier than ever to pipe SQP metrics into your existing analytics dashboards (e.g., Google Data Studio, Power BI, or dedicated Amazon analytics platforms like MerchantSpring’s). You could maintain a live dashboard that updates each week with the latest impressions, clicks, and conversion rates for your top keywords. This real-time view is invaluable – for instance, if a key term’s purchase rate drops sharply one week, you’d see it right away on your dashboard and can investigate immediately, rather than finding out weeks later. Teams can even set up alerts: e.g., if click share on any “top 10” keyword falls below a certain threshold or if a new high-volume query emerges, an email or Slack notification pings the responsible manager. Automation ensures you “never miss a beat,” catching trends or issues as soon as they happen.
-
Historical analysis and benchmarking: By pulling data via API, you can easily store and accumulate historical SQP data. Over a few months, you’ll build a rich dataset that allows for deeper analysis – trending charts, period-over-period comparisons, and benchmarking across products or brands. For example, you might compare Q1 vs Q2 search trends in a single view, or benchmark Product A’s funnel metrics against Product B’s to spot conversion differences. This was technically possible before with manual downloads, but the API makes it seamless and less error-prone. It also enables multi-brand comparisons if you’re an agency: you could aggregate anonymized data to glean industry benchmarks (like what’s a “good” click share in a certain category).
-
Integrated SEO + PPC insight: Perhaps one of the most powerful outcomes of API access is the ability to combine SQP data with other data sources automatically. Imagine blending your SQP organic search data with your Advertising reports or Retail Analytics. With the API, you could, for example, correlate changes in ad spend to changes in organic share for a keyword week by week. Or integrate inventory data to see if stock-outs affected your search performance. This holistic view can uncover relationships that were hard to spot when data lived in silos. As Intentwise noted, now you can track your ad performance with the full context of how your product stacks up organically in search, all in one place. It’s “all the power of the SQP data, but easier to automate, segment, and put into context”.
Examples of workflows unlocked by the API: To make this concrete, here are a couple of use-case scenarios:
-
Weekly SEO/PPC sync: Every Monday morning, your system pulls the latest weekly SQP report via API. It then generates a summary highlighting the biggest changes (e.g., “Keyword X: impression share dropped from 10% to 5%” or “New Query Y entered top 50 by volume”). Your marketing team reviews this alongside last week’s ad spend report in a joint meeting. They discover, for instance, that a competitor’s aggressive PPC campaign might have cut into your click share on Keyword X, so they plan a counter-strategy. This kind of agile response is possible only because the data was readily available and up-to-date.
-
Monthly performance dashboard: At the end of the month, you have an automated dashboard (perhaps built in MerchantSpring Analytics or a BI tool) that refreshes with the full month’s SQP data. In your monthly business review, you show a funnel chart of how a specific keyword’s impressions->clicks->purchases changed from last month to this month, and tie it to the initiatives you took. For example: “We improved the images for Product Z in mid-month, and you can see its conversion rate on the main keyword rose from 8% to 12%, increasing our purchase share.” The dashboard might also include a search query funnel diagram visualization for a top keyword, or a line chart of search volume vs. your purchase count over several weeks, which makes it easy to explain performance to stakeholders. Because the data feed is automated, these insights are ready with minimal manual prep.
-
Multi-market or multi-account integration: If you sell across multiple Amazon marketplaces, the API can fetch SQP data for each locale (US, EU, etc.), allowing you to build a global view of search term performance. Similarly, agencies can plug the API into their internal tools to manage multiple client accounts from one interface. One Reddit commenter aptly noted that with API access, “you’re going to see a LOT of tools start incorporating this” – meaning third-party software (and in-house solutions) will offer new analytics capabilities leveraging SQP data. MerchantSpring, for instance, can integrate the SQP API into its platform to provide Marketplace Masters (Amazon agency professionals and brand managers) a more automated, comprehensive reporting experience.
In summary, the new SQP API access brings ease of use and scale to an already valuable dataset. It allows sellers to automate SQP reporting, build custom analytics, and react faster to changes – all of which can translate to a competitive edge on Amazon. If you’ve been manually pulling reports to optimize your Amazon SEO, the API is a game-changer: it’s like going from a horse-drawn carriage to a race car. Now you can truly stay on top of Amazon search dynamics in real time and integrate those insights into every level of your operations.
Conclusion & Call-to-Action: Amazon’s Search Query Performance Report has quickly become an indispensable resource for brands looking to sharpen their Amazon SEO and advertising. Whether you’re using it to fine-tune a single ASIN’s listing or to shape a broad keyword strategy for a brand, SQP offers the kind of data-driven clarity that was once hard to come by. And with the recent API update, accessing and acting on these insights is easier than ever.
At MerchantSpring, we’ve seen firsthand how leveraging SQP data (and automating it via our analytics platform) can lift a brand’s performance across the board. If you’re an Amazon agency professional, brand manager, or marketplace seller aiming to stay ahead of the competition, it’s time to make the most of Amazon SQP.
Interested in taking your Amazon analytics to the next level? We invite you to book a demo of MerchantSpring’s platform – see how you can integrate the SQP report into a comprehensive dashboard, visualize your keyword funnel, and unlock growth opportunities hidden in your search data. Let’s turn those search queries into actionable strategies and optimized Amazon product listings for sustained success.


Add a Comment