Our Guide to Amazon Performance Metrics You Should be Measuring in 2021

Every e-commerce seller is aware of the rule: use your data to boost sales. On Amazon, sellers are likely to be aware of the importance of Amazon KPI (Key Performance Indicator) metrics. Sellers and brands can easily obtain, manage, and evaluate their Amazon seller KPIs with a plethora of data and analytical solutions at their fingertips. Amazon sellers and brands can use these KPIs to monitor data and create actionable insights that fit with their long- and short-term objectives.
Keeping a handle on your metrics is vital if you want to go the full distance and achieve success - whether it's brand recognition, revenue, attracting new customers, or doing Amazon KPI analysis.
Unfortunately, Seller Central does not make life easy for Amazon sellers. It can be a source of great frustration, as there are certain functions that Seller Central doesn’t do well, or offer at all. Most sellers are selling themselves short due to limitations to the basic reporting interface on Amazon.
One of the most common complaints sellers have about Seller Central is the data it provides. What is the reason for this? Since the information you need is often unavailable. Let's say you're attempting to increase your listing quality. For additional photos and videos included in your listings, you won't be able to get data on average session time or view counts. This means you don't get a clear view of how your listings are doing, making it difficult to figure out what needs to be improved. You are left to your own devices to play with.
Even if the information is available in Seller Central, it is often obtained from other data. You can get a general idea, but not a detailed breakdown of individual elements.
Even the more experienced among us find Seller Central frustrating. Here’s what they think:
“I find that there are many issues with the ease of reporting on Seller Central. The PPC data is only retained for a few months unlike many of the available tools out there. ACOS is also reported on sales including VAT which isn’t helpful and there is no TACOS metric to view which we find a lot more useful KPI. Being able to see splits between Organic and PPC sales by-product is also an issue and sales reporting is difficult to see trends over different periods of time, which a tool can do with a push of the button.”
Rupert Segal, OTL Ltd UK
“One of my biggest frustrations with Amazon's Seller Central data is the inability to view SKU-specific data over time. Checking things like daily changes in sessions or units sold is a great way to measure the change in performance over time - but you can only access this data on aggregate for the account by or per SKU aggregated over an entire time frame instead of day by day within that time frame. It makes a lot of unnecessary work to view time frame comparisons.”
Michael Begg
Despite knowing how important it is to work toward achieving, and maintaining sales, the built-in reporting in Seller Central can be complicated, underwhelming, and limited. Amazon Seller Central can be extremely frustrating due to the limitations of the reporting within Seller Central and how difficult it is to get the data out of Seller Central.
Sellers don't have to guess how to improve their customer engagement and acquisition efforts if they know where to look for important data, how to use it, and rely on the measurements to keep them on track and allow them to grow their Amazon business. To help sellers take advantage of their Amazon data, we’ve created a guide to the metrics you need to be tracking on the marketplace.
Product Ranking
Experienced sellers know that the vast majority of customers never go beyond the first page of search results, and the vast majority of them click on one of the top five results. Amazon’s Best Seller Ranking (BSR) is without a doubt, one of the most important metrics to monitor on Amazon. Your product ranking has a significant impact on whether or not a customer engages with your product.
A variety of factors are used to determine a product's rank; however, the primary component that affects the ranking is the product's sales history on Amazon. The Best Seller Ranking is updated every hour to reflect not only historical sales data but also current sales data. When a customer conducts a product search, Amazon's sophisticated algorithms determine which products best match the customer's inquiry and present the most relevant product options to its customers.
A higher-ranking product sells quickly, which is good, but it also usually indicates fierce competition and low-profit margins. The Amazon product ranking metric is an excellent resource for determining which products to sell on Amazon. The metric should determine your decision when choosing inventory to sell. You should try to avoid products with extremely low BSR rankings, as these products are unlikely to sell well.
Finding the best rating is a delicate juggling act. However, if you can find a product that you believe has a potential market and profit opportunity as well as room for you to optimise and improve its BSR, then that is the sweet spot to aim for.
Order Defect Rate (ODR)
Essentially, your ODR is the number of customers who have a bad experience with you as a seller.
The Order Defect Rate is something that all Amazon sellers should be concerned about. This metric is one of the most important measurements tracked by Amazon and is used to assess your health as a seller. It is tracked to ensure that no more than 1% of the seller's orders fall into "defect" mode.
It has the power to determine who wins (or loses) the all-important Amazon Buy Box.
It sometimes gets accounts deactivated.
It always keeps track of which sellers are consistently providing positive customer experiences — and which are consistently failing to meet customer expectations.
The Order Defect Rate metric is calculated using three components:
Negative Feedback rate
When your customer provides negative feedback, it reflects a poor customer experience. A poor customer experience will result in more negative feedback and a high rate of order defects. This will be calculated based on the total number of orders received during a given period.
Filed A-to-Z Claim Rate
If a customer is dissatisfied with something about an order purchased from a third-party seller and the customer and seller have not been able to resolve the issue through emails between the two of them, the customer has the option of contacting Amazon directly to resolve the issue.
A-to-Z claims are bad news for sellers because they are interpreted as an indication that the seller is unable to resolve problems with Amazon customers on its own.
Service Chargeback Rate
Chargebacks are credit card charges that the customer disputes. If someone requests a refund, it may have an impact on your order defect rate. People ask for money back for a variety of reasons, including fraud, poor service, receiving damaged goods, or never receiving a refund for a return. If the credit card chargeback was caused by your customer service, it will affect your order defect rate.
These are the primary factors Amazon considers when calculating your order defect rate. There is never a time when you should stop prioritising your Amazon Order Defect Rate. If you want to keep your Amazon store attracting customers, you must keep your ODR below 1%.
Pre-Fulfilment Cancellation Rate
This is the percentage of orders cancelled by the seller before they were shipped.
This metric includes all order and item cancellations initiated by the seller, excluding those requested by the customer through their Amazon account's order-cancellation options. Pending orders or items cancelled directly by the customer on Amazon are not included.
For example, if you received 100 orders but cancelled 5 of them before you had the chance to dispatch them from the warehouse, then you would end up having a 5% cancellation rate, which is not what you want. This rate is calculated by dividing the number of cancellations by the number of orders placed during the same time.
It is critical to ensure that the products you list on Amazon are in stock and ready to ship. When you cancel an order or individual items within an order before fulfilment, it is usually due to a product being out of stock.
Sellers must maintain a CR of less than 2.5 per cent. Furthermore, if the seller is forced to cancel multiple orders due to a pricing or inventory error, the seller may quickly find itself in hot water with Amazon and face account deactivation. Plus, in the short term, a high cancellation rate also harms your bottom line because an unfulfilled item or order results in lost revenue for your company.
Late Shipment Rate (LSR)
The proportion of orders with a ship confirmation that is completed after the expected ship date is referred to as the late shipment rate. Nothing is more infuriating to a customer than receiving their order after its expected delivery date. Late shipments result in negative reviews, so on-time shipping is critical to ensuring customer satisfaction.
If you are two or more days late in shipping an order, Amazon will consider you late. This metric is calculated on a weekly to monthly basis. If your late shipment rate approaches 4%, Amazon will send you a notification.
When you think about it, two days is a pretty generous threshold, so it's not a difficult target to meet, though there may be times when you can't. When you consistently ship your products late, it gives the impression that your business is sloppy, disorganized, and unconcerned about customer satisfaction. This is why LSR is another metric you'll want to keep an eye on to ensure you're providing the best customer experience possible for your target audience.
Return Dissatisfaction Rate
A Return Dissatisfaction Rate has been added to the Amazon seller dashboard, which tracks consumer satisfaction with how returns are handled. The score is based on the percentage of legitimate return requests that were not responded to within 48 hours, were wrongly denied, or received negative reviews from customers. Essentially, this metric represents the percentage of consumers who were dissatisfied with your Buyer-Seller Messaging responses.
The Return Dissatisfaction Rate was developed by Amazon to help sellers understand where they can boost their customers' returns experience and avoid allegations and negative reviews.
It looks into three main areas once the return is processed:
- Negative Return Feedback Rate: when a return request has negative buyer feedback.
- Late Response Rate: when no response is provided for a return within 48 hours.
- Invalid Rejection Rate: when a return is incorrectly denied.
On their account health dashboard, the seller can see their ratings:
- Good - If this column has a green checkmark, the seller's output is meeting Amazon's goal for this metric.
- Fair – A yellow checkmark that indicates the seller's performance currently falls short of Amazon's expectations for this metric.
- Poor - A red "X" in this column indicates that a seller's performance is currently below Amazon's goal for this metric.
While your account would not get suspended nor would your main metrics not get affected, you should still aim to build a good seller-buyer relationship to avoid customers making A-Z claims.
Inventory Performance Index (IPI)
The Inventory Performance Index is a relatively new metric introduced by Amazon to ensure that all inventory moved quickly enough, leaving enough space at FBA for in-demand items
The IPI is a score that Amazon assigns to sellers to determine how well they manage their inventory. The score is assigned a value between 0 and 1000 and sellers can see their current score in their Inventory Dashboard within Seller Central. Amazon determines the target score based on the amount of storage Amazon believes it will require to accommodate all in-demand products in a given quarter.
The IPI, like many of Amazon's decisions for sellers, appears to revolve primarily around Amazon's overflowing warehouses and attempting to get sellers to better optimize their inventory.
What’s frustrating, however, Amazon refuses to comment on how IPI is calculated.
Currently, though Amazon says three factors affect your IPI score:
- Excess inventory must be reduced to increase profitability
- Increasing sell-through to balance your inventory weeks of cover
- Making sure inventory is available for purchase by resolving stranded listings
- Increasing sales by keep re-stocking popular items
The punishments for a poor IPI score are inventory storage restrictions and higher storage fees ($10/CFT to be exact).
In their recent update, Amazon announced that the IPI score will be lowered to 450. This means that as long as a seller’s IPI score remains above 450, they will still have unlimited storage at FBA warehouses.
Sales & Traffic
Don't get caught up in the pit of just focusing on reviews; high page engagement is also significant. Reviews are just one aspect of your market, and they're a little more illusory than the cold hard facts provided by Amazon Business Reports. Hidden in all the stats is the story of your store. It reveals how new and returning customers engage with your products, how often they order them, and how much of your product they're able to order all at once.
It may get a bit overwhelming but the following metrics appear in the Sales and Traffic section and they all affect your product ranking.
Total Sales (Ordered Product Sales & Gross Product Sales)
This is simply your product price multiplied by the number of units ordered, which gives you a total sales figure. Your gross product sales equal the sum of your merchandise sales, your ordered gift wrap number, and your ordered shipping amount. Consider it the cumulative amount of money your consumers have spent on your product, including fees not related to the product.
You should always know precisely how much money you make from your Amazon store. By monitoring Total Sales, you'll be able to track overall product revenue both with and without add-ons and shipping costs, giving you net and gross numbers to work with. Correlating total sales with units ordered alongside page views and sessions will help you see how your business is performing as a whole.
Units Ordered
This metric simply displays in detail the number of products your customers have ordered from you in total. Use these metrics to keep track of your unit orders and spot some numbers peaks and troughs. Essentially, the more units you sell, the higher you rank and it will eventually have a direct influence on where your product ranks on Amazon. Shifting units should be at the top of your priority list, and if it isn't, you should investigate why as soon as possible.
Sessions
For Amazon sellers, the Sessions metric can be a source of great anxiety, so don't feel bad if the concept of a Session escapes you for a moment. To put it simply, the Sessions metric is just a way of tracking traffic. Consider it this way:
A customer who walks into your Amazon store can be thought of as a session. They see product one but don’t add it to their cart. Then they see product two and add two units to their cart. After, they see product three and add another unit to their cart. Next, they may pick up other items, read their labels, put some in their cart and place some back on the shelf.
So, even though they looked at a few items, (and therefore racked up page views) resulting in a total of four-page views, this all happened within one shopping trip (or one session).
Amazon counts this as one session. If the number of pageviews is almost equal to the number of sessions, this may be a negative indicator. It could mean that you aren't sustaining the interest of the customer. This might be a sign that you have issues with your pricing strategy or product description, etc. Nevertheless, you'll have the chance to make changes that will affect your page views and session metrics.
Buy Box Percentage
When a customer visits a product listing, the Buy Box appears on the right-hand side and shows what Amazon determines to be the best price for the consumer. To appear in the Buy Box, sellers must meet performance-based criteria, and if more than one qualifying seller sells the same product, the Buy Box will be competitive. The Buy Box percentage indicates how often consumers saw your product in the Buy Box.
If your Buy Box Percentage is high, that's a positive sign because it means you're regularly winning the buy box, which means Amazon thinks your product is a good deal and wants to show it to consumers, which means you'll probably make more sales.
However, If your Buy Box percentage is low, consider whether your product was ever out of stock or whether you are competing with another seller for the Buy Box. Make sure your products are competitively priced and always in stock to maximize your chances of being included in the Buy Box. Or you can also try to offer free shipping if possible and ensure that you always offer excellent customer service.
Unit Session Percentage or Conversion Rate
Amazon conversion rates are one of the most significant indicators for sellers yet it is often forgotten by most FBA sellers and it’s not the easiest thing to grab from Seller Central. Conversion Rate is a critical factor in Amazon's A9 Algorithm for making your company profitable because they help you rank higher on Amazon for your target keywords.
Your daily number of sales is NOT the same as your unit session percentage, also known as your conversion rate. Your conversion rate is your number of sales (Total Sales) divided by the number of times people visited your listing (Sessions). Your conversion rate is the percentage you receive.
It's difficult to tell what makes a "healthy" Amazon conversion rate because it varies depending on the products that you sell. On average, a reasonable conversion rate on Amazon should be between 10% and 15%.
The conversion rate metric indicates how many profits the company generates. You want a high conversion rate because it means people are visiting your website and purchasing your products. A high conversion rate means that the product is selling well and that customers are interested in purchasing it. If your conversion rate is poor, you'll need to change your strategy to get better results.
Although Amazon will not suspend your account due to low conversions, it is in your best interest to maintain a high page ranking and make sales! This can be done by performing keyword research, creating compelling product descriptions, uploading high-quality images, keeping your price-productive, and sending follow-up emails to customers who recently have made a purchase.
Invoice Defect Rate
This metric is quite a new one. In June 2020, Amazon announced a new performance metric in Account Health: Invoice Defect Rate.
To comply with this new Amazon Business invoicing policy and keep your Invoice Defect Rate at 0% what you need to do is to enrol for:
- Amazon VAT Calculation Service (for VAT registered sellers) OR
- Automatic Receipt Generation (for Non-VAT registered sellers) after you declare your VAT exemption status
So, if you don't send an invoice (or receipt) to a business customer within 24 hours of receiving an order, you'll receive a mark against your Invoice Defect Rate. If the rate rises above 5%, Amazon may suspend your account.
A Tool to Help Track Amazon Performance Metrics
Your performance metrics have an impact on the success of your Amazon store. You should keep an eye on them at all times to know where your store stands.
If your Amazon store is performing well, your rankings will reflect this. Conversions and a positive user experience will help your products rank higher in search results. You'll get more valuable leads and boost the performance of your store.
But with so many metrics to monitor, we understand that it can be overwhelming - not to mention when they keep adding a new metric to Account Health.
The basic reporting interface on Amazon might not be enough to help you accelerate your selling efforts. This is why you need a tool to help you track your Amazon Performance Metrics
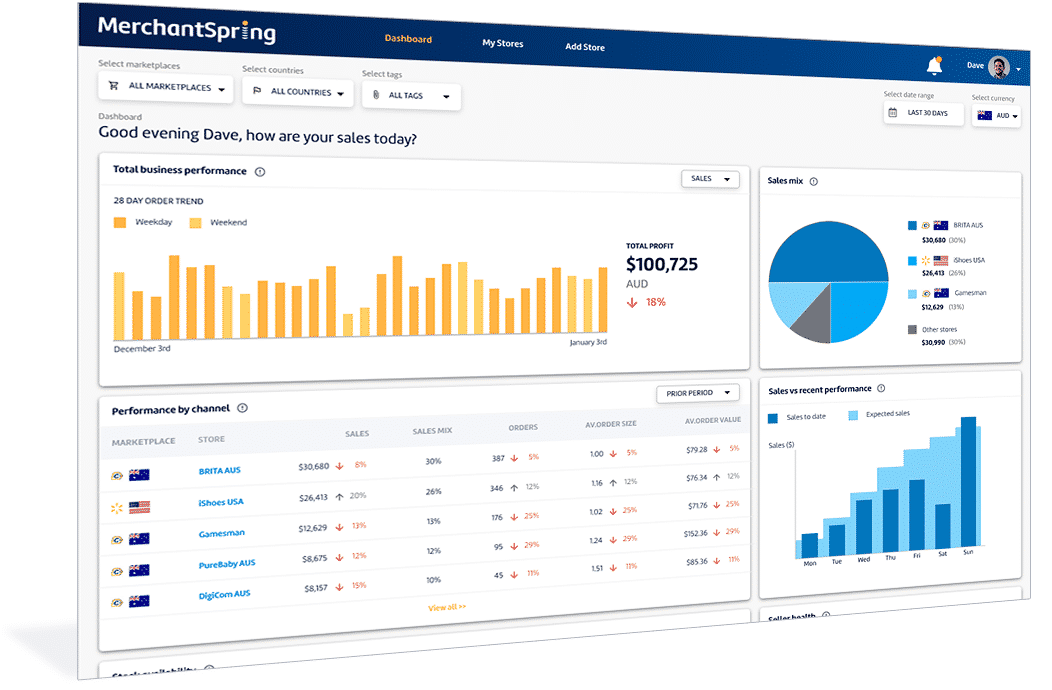
Fortunately, MerchantSpring is here to help!
Our Amazon Advertising dashboard shows real-time performance across your Amazon account. We collect and link Amazon advertising performance data on your behalf so you can focus on insights and decision making, safe in the knowledge that your performance metrics are at your fingertips.
See what other sellers are saying about our reporting tool:
“Analysing my sales data is very important to me. I like how MerchantSpring provides a quick, clear view of all sales activity in one place while allowing me to dig deeper into the trends for individual stores. The customer service has been excellent, I would highly recommend!”
James Parker, UK
“Very useful tool for those with multiple marketplace accounts.
“The most efficient way to stay close to sales metrics/performance (no need to login to multiple selling accounts anymore)”
“Great suggestions for eBay listings also to lift performance”
Robert Jeffs, AU
“I am very satisfied with the product. I haven't found any other tools that will allow me to see real-time sales data from all of my sales channels in one place.”
Tiffany Etterling, US


Add a Comment